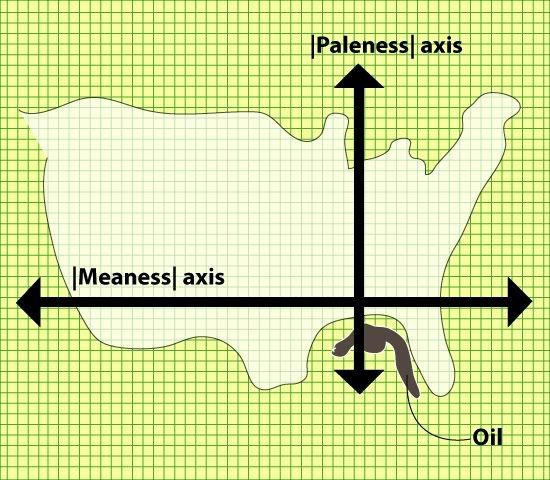
In school I learned a lot about graphs and diagrams. How to read them, what they mean, identifying trends, analyzing their roots. You can learn a lot from a simple picture. For the most part these graphs were pump curves or triple point thermodynamic curves. But that doesn't mean the graph can't be a useful tool for daily life. Here are two examples showing a "general trend" of two characteristics of college age women vs. geographic location.
The Venn Diagram

The Standard x-y plot


boooooooo! two thumbs down! girls from the northeast are the best.
ReplyDelete-Lee